Seven things, one screen.
My Journey is one screen with seven sections. Only one is open at a time, so the app shows you a single thing rather than a dashboard.
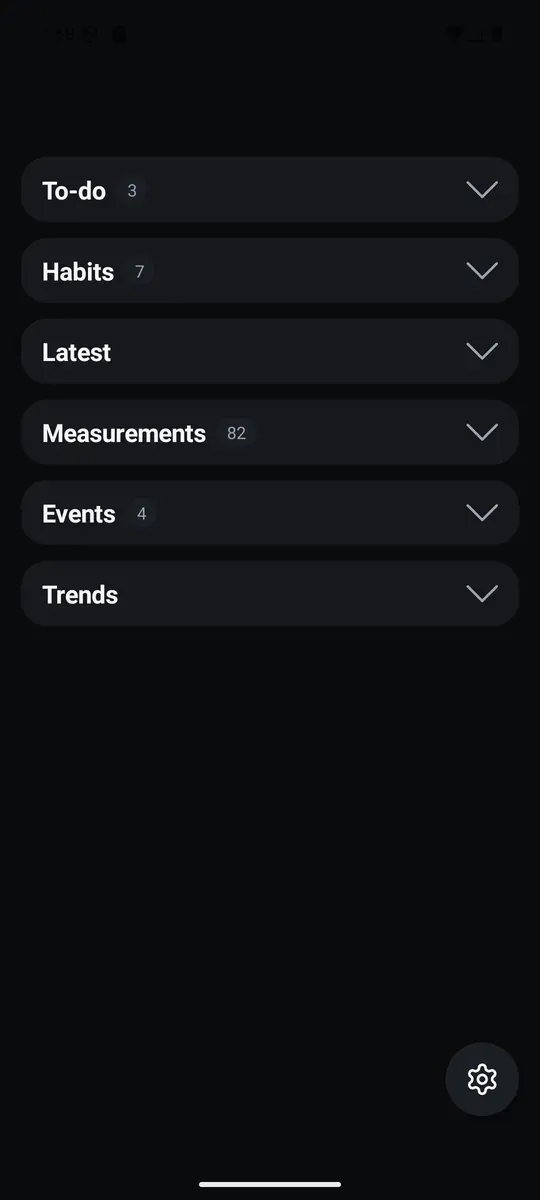
To-do
Type a task, press Add, and it joins a list ordered newest first. Tick it off and it moves to a Done group that stays collapsed until you want it.
Removing something asks once, in place: the label turns to "sure?" and waits a few seconds. The app never opens a dialog to ask you a question.
Habits
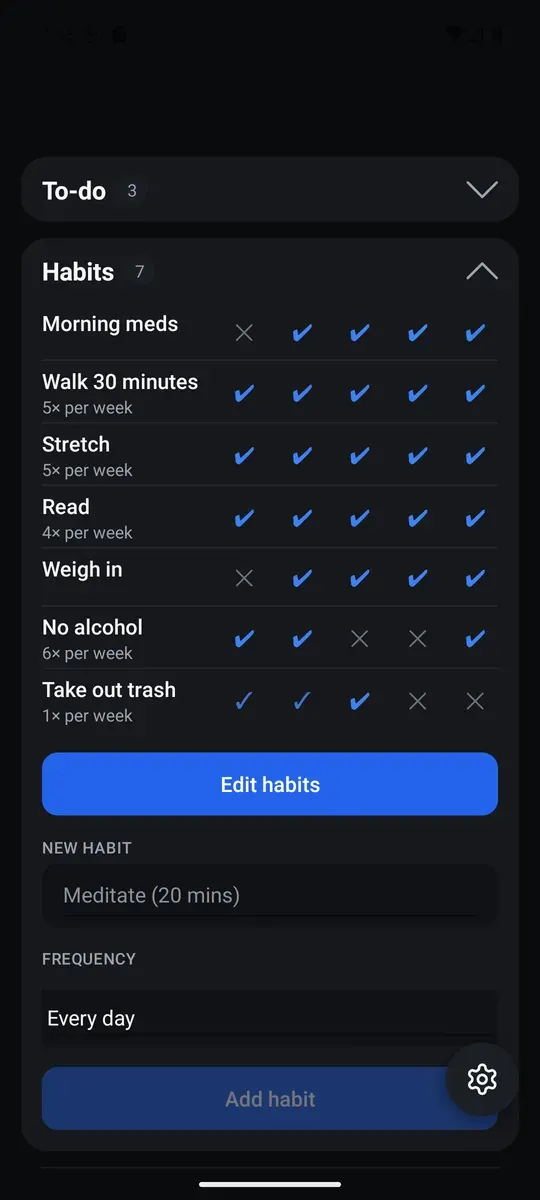
One row per habit, one column per day, today on the left and the previous fifty-nine days to the right. Tap any cell to mark that day.
A habit can be every day, or a number of times per week or month. The marks work that out for you: a day you did it, a day the week already covered, or a day you missed.
Latest
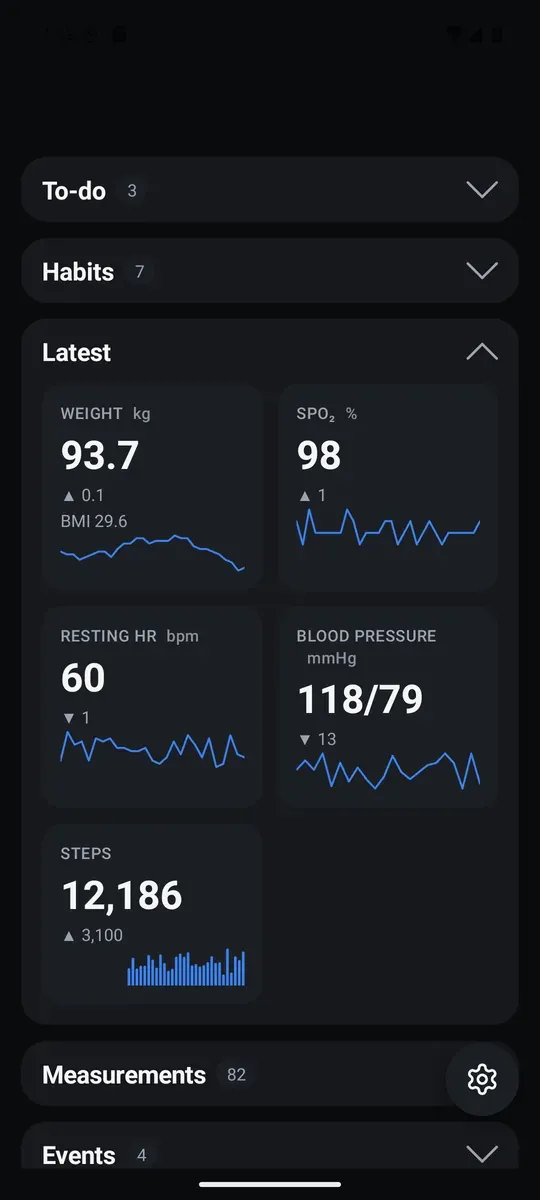
Five cards — weight, SpO₂, resting heart rate, blood pressure and steps. Each shows the most recent value, how it moved since the one before, and a sparkline of the last thirty readings.
A change is shown as an arrow and a number, and that is all. The app never colours a direction good or bad. Weight carries your BMI on its sub-line once you have entered a height.
Measurements
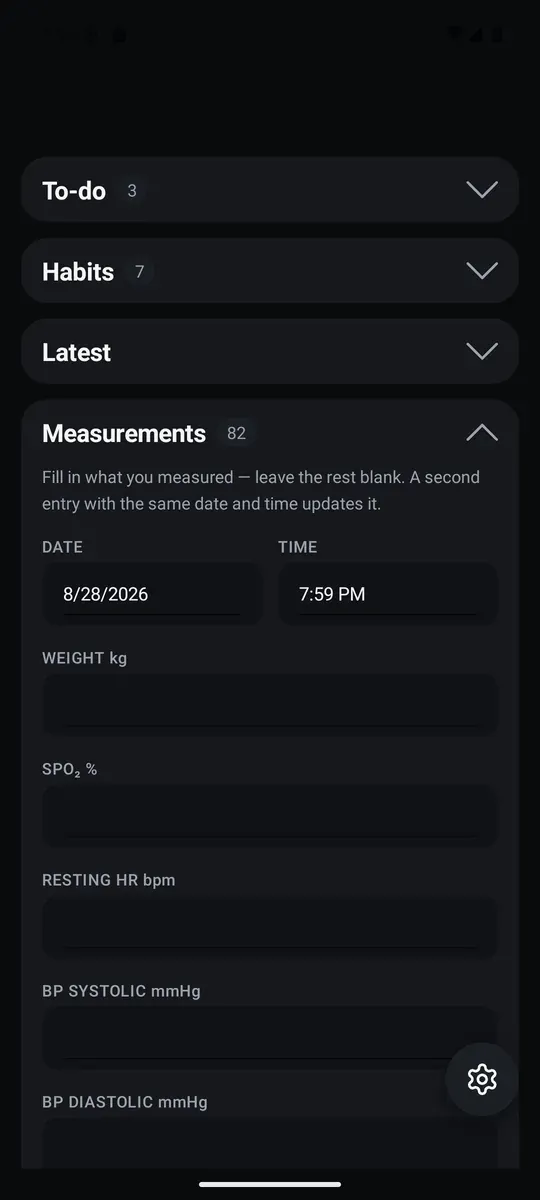
Fill in what you measured and leave the rest blank. Date and time default to now, and a second entry at the same date and time updates the first rather than duplicating it — blank fields never overwrite what is already stored.
Steps are separate, one value per day. Both histories list newest first, and tapping a row lets you clear a single mistyped field without losing the rest of the reading.
Events
Milestones worth marking — quit smoking, a fast started, a new medication. Give it a name and a moment.
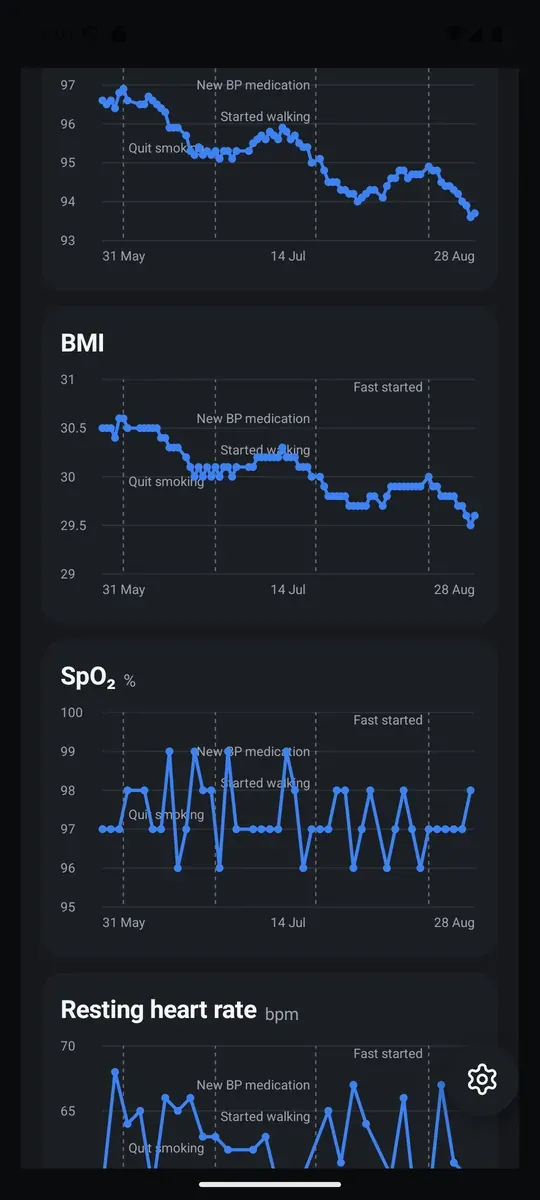
Every event then draws itself as a dashed line on every chart whose range contains it, so a change in the numbers sits next to the thing that might explain it.
Trends
Six charts — weight, BMI, SpO₂, resting heart rate, blood pressure and steps — over the last thirty days, ninety days, or everything you have recorded.
They are deliberately still: no zoom, no panning, no tooltips, nothing to tap. A chart without at least two points in range says so instead of drawing a misleading line.
Backup
Your whole history as one line of text. Show it to copy somewhere safe, or save it as a file and send it wherever you like — a drive, an email, another phone.
Restoring takes that line back. It replaces your history and writes a snapshot first, so the action can be undone, and it leaves your settings alone: a three-month-old backup will not silently change your theme or your units.